Mechanics of Fatigue Improvements
Elementary mechanics example of residual stress enhancement in performance applications by reviewing a relatively simple sample problem.
Posted: January 13, 2017
By:
Our website contains several statements about the residual stress generated by laser peening and the superiority it provides over conventional surface treatment methods. But have you ever considered HOW the residual stresses actually benefit an application? This article provides an elementary mechanics example of residual stress enhancement in performance applications by reviewing a relatively simple sample problem.
Imagine you are an engineer working on a new mechanical linkage design for a steering assembly. The mechanical linkage in once section of your design consists of half-inch diameter hardened steel rods subjected to bending loads. Once particular location in the design is subject to slightly higher bending stresses than the remainder of the structure. This stress application is observed during every cycle of adjusting the steering. In analyzing the linkage section, it was determined the maximum bending moment observed is 1200 pounds per inch.
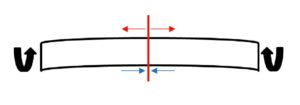
This problem can be visualized by taking a pencil in your hands and trying to snap it in half. A schematic of this would appear as:
The red arrows in the image indicate the area that is placed into tension by the bending forces. The material at the top of the rod is being pulled apart (tension) and the material at the bottom of the rod is being squeezed together (compression).
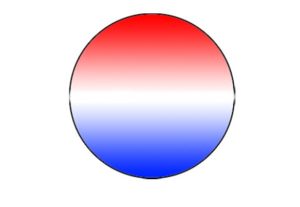
To understand what is going on inside of the rod, picture a slice through the center of the rod and evaluate how the stresses are distributed through the area (cross section). The image below shows a representative stress distribution with tensile stresses indicated in red and compressive stresses in blue. The magnitude of both is highest at the top and bottom of the cross section and fade to 0 at the center (neutral axis).
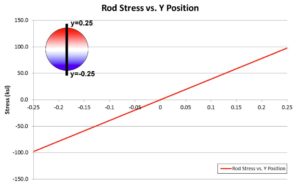
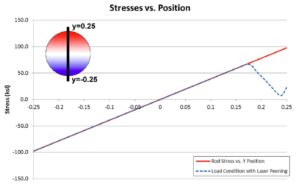
If we were to plot the stress state through the cross section down a center-line, with y=0 at the center of the rod, it would appear as:
Stress values predicted for the rod with this bending load are approximately 100 ksi. Assume our steel rod is AISI4130 with a yield strength of 125 ksi. The stresses indicate the applied stress state is below the yield strength of the material and would have a safety factor of approximately 1.25.
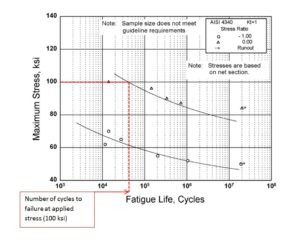
While this design would be acceptable for stress based design conditions, when the design is examined for fatigue life, the stress state would suggest the component would fail after 40,000 cycles. This is simplified by examining the fatigue plot (applied stress vs. lifetime) shown below [SOURCE: MMPDS 4340 STEEL]. Assuming this stress cycle occurs approximately 5 times per minute, this design would likely begin to crack after 130 hours of usage. Whether 130 hours of usage is acceptable or not is difficult to assess without additional information. For this example, assume 130 hours is not acceptable.
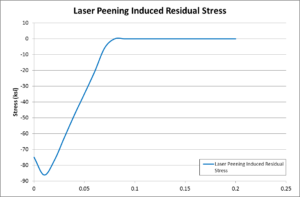
Now, suppose we consider this same applied stress state with laser peening applied to the geometry. The total stress state of the bar would appear as the superposition (combination) of the laser peening induced stresses and the applied stress state. For this material, suppose the laser peening induced residual stresses have a magnitude of 75 ksi-85 ksi compressive stress diminishing to 0 at a depth of 0.075 inches. The in-depth residual stress profile would appear as:
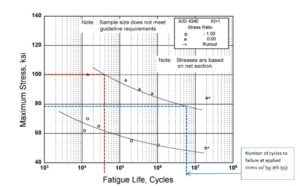
The superposition of the laser peening induced residual stresses and the applied stresses can then be plotted on the same stress distribution graph used earlier. The chart demonstrates that laser peening has reduced the maximum realized stress state to 65 ksi (35% drop in maximum stress).
As a result, the new stress state may also be evaluated on the previous fatigue life plot. At 65 ksi, the expected fatigue lifetime would be on the order of 6 million cycles. This represents a 150 times life increase in the part a the designated service stress.
Hopefully you have found this information to be useful in understanding how laser peening generates physical performance benefit in materials and applications. If you have questions or would like to discuss your particular application, please Contact Us.
Written by Stan Bovid, Senior Metallurgist, LSP Technologies, Inc.
Interested in Seeing More?
Tell us about your application, material, or failure mechanism and we will have one of our experts reach out to you. Our extensive library of research and years of experience gives us a unique advantage to apply a finite element analysis to help diagnose the best application for your situation.

